Enhanced Reporting System
The Enhanced Reporting Dashboard provides a comprehensive and intelligent view of your organization's data and metrics. It offers advanced features including AI-powered report composition, intelligent summarization, real-time previews, and sophisticated data analysis tools to help you analyze and manage your information more effectively than ever before.
Dashboard Tabs
Overview
The Overview tab presents a high-level summary of your organization's key metrics. It includes:
- Resource counts (e.g., Patients, Appointments, Documents, Tasks, Observations, Questionnaire Responses)
- Trend indicators for each metric
- A time-based bar chart showing new patients and tasks over time
Campaigns
If the campaigns feature is enabled for your organization, this tab provides insights into your campaign performance and metrics.
Enhanced Reports Interface
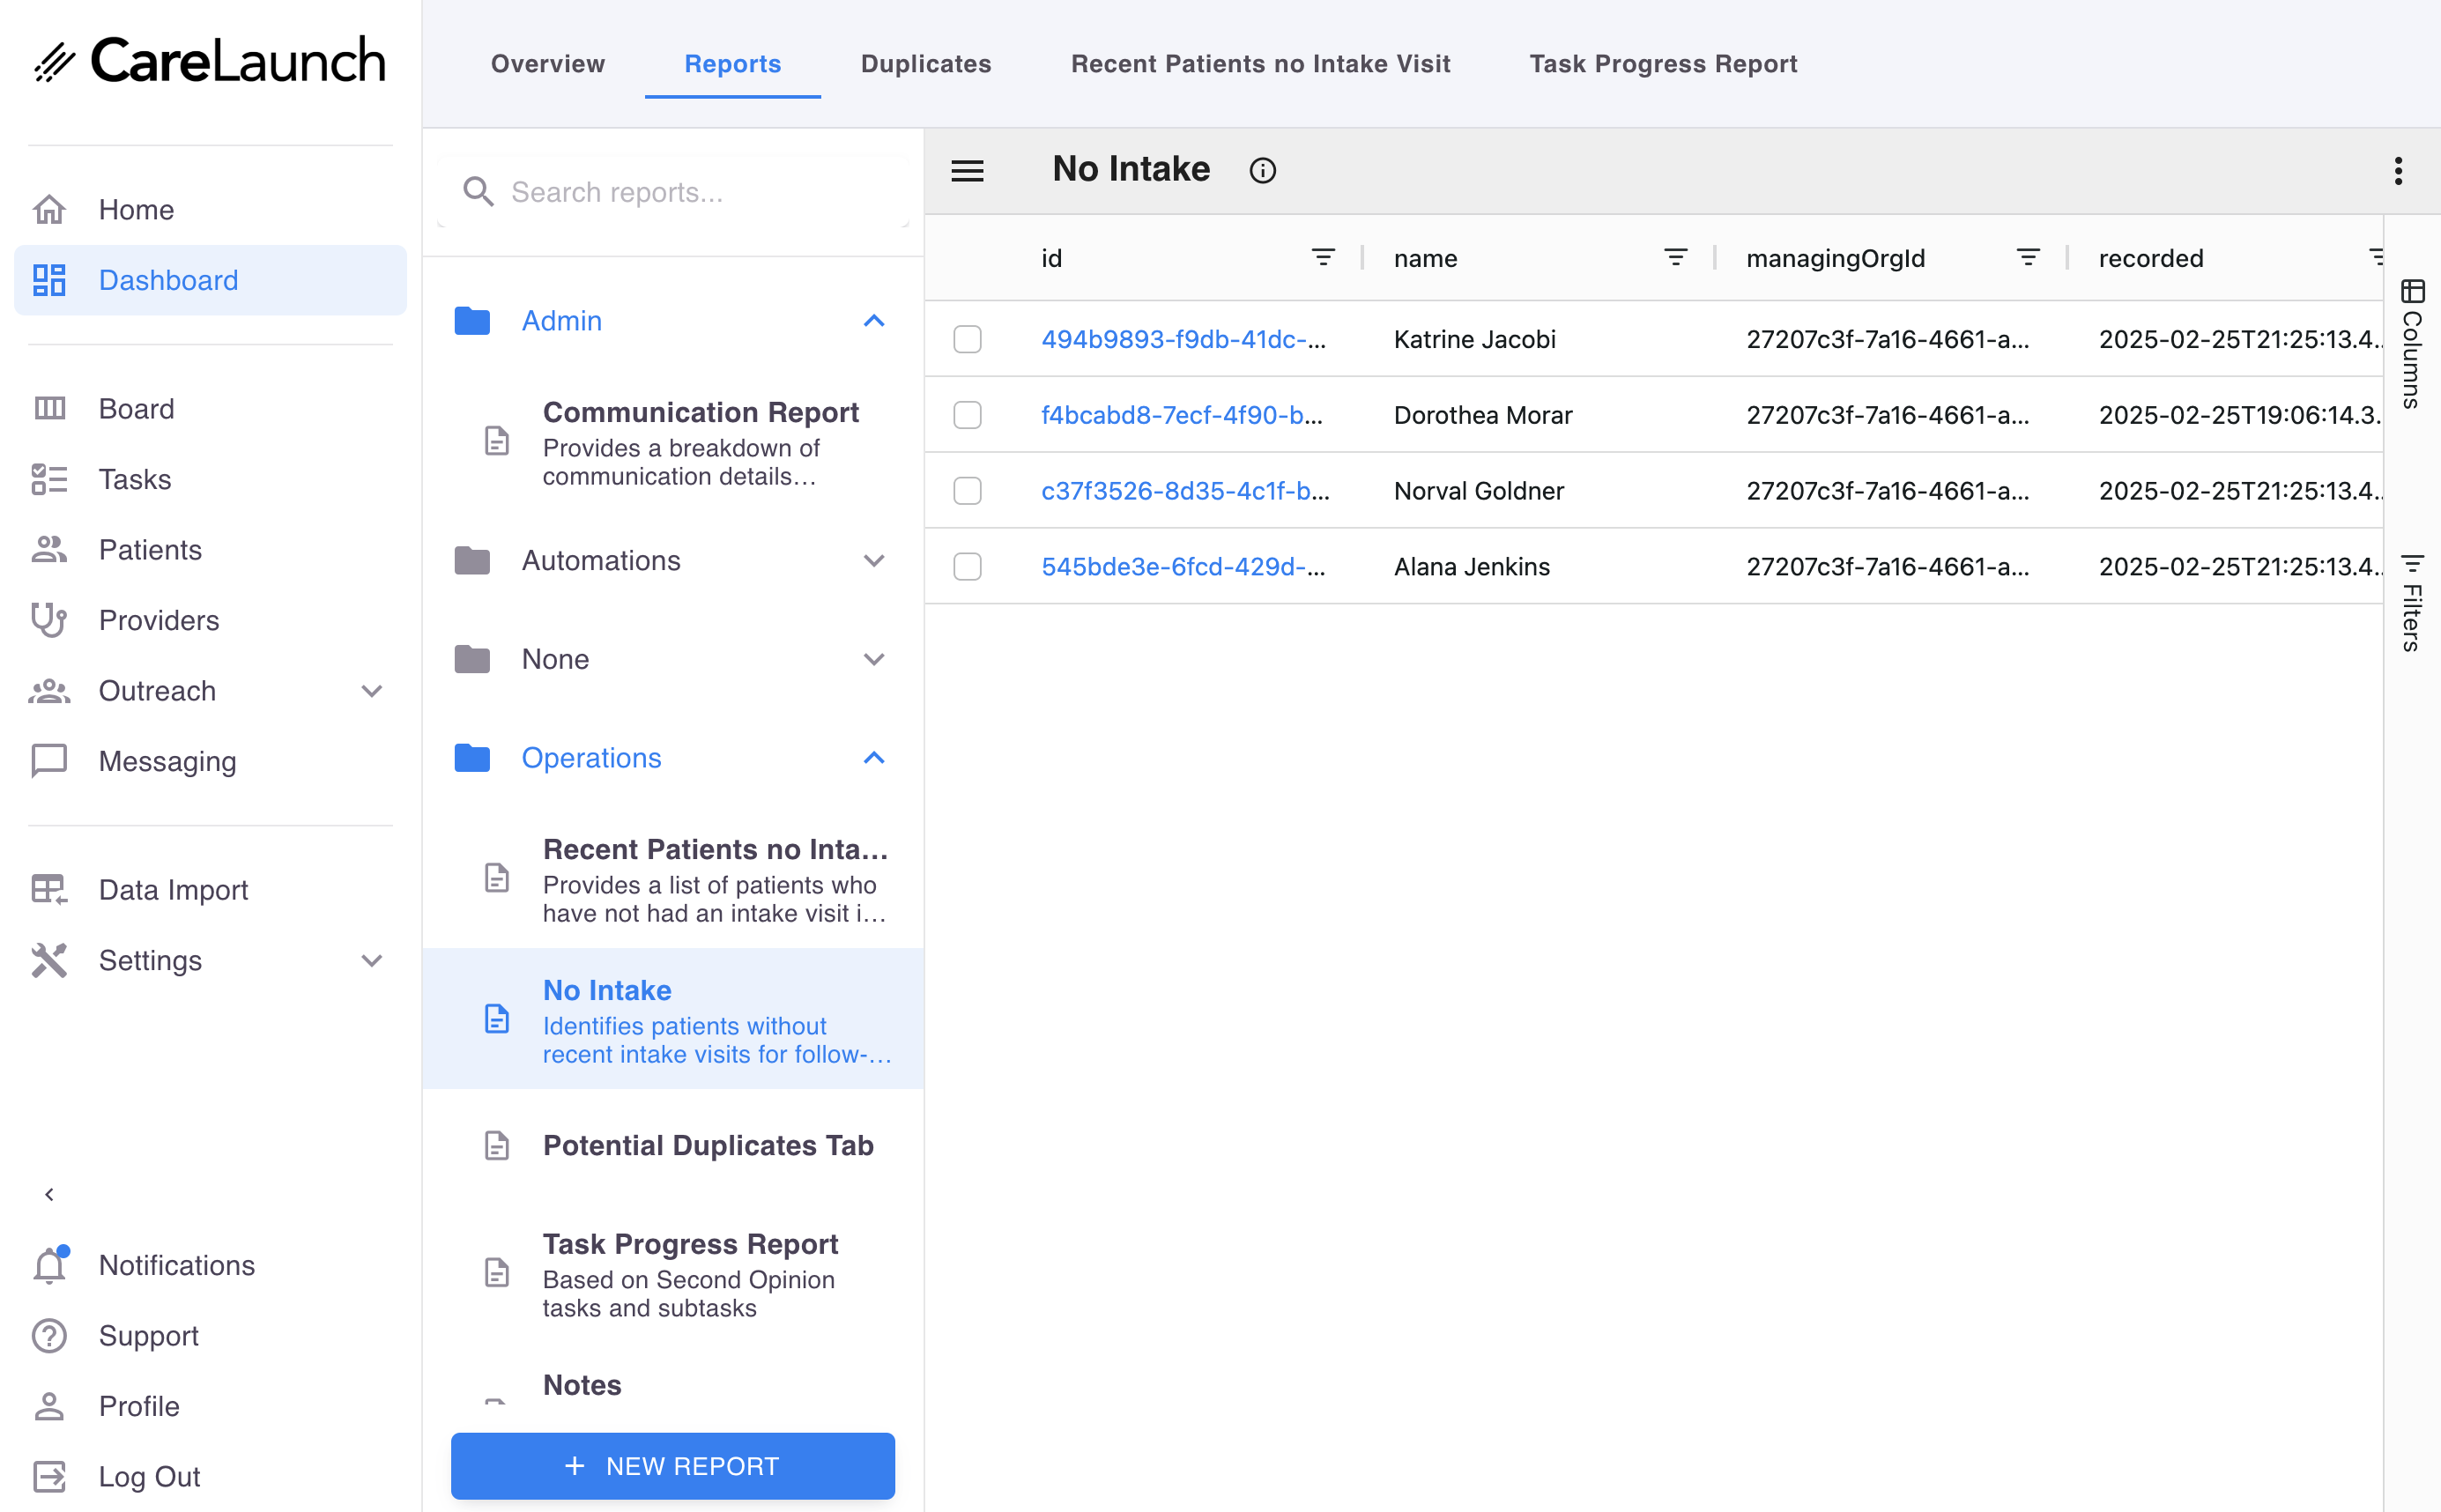 Example of a report showing patients without intake visits
The Reports tab has been completely redesigned with advanced features and intelligent capabilities:
New Interface Features
- Redesigned report search interface with improved filtering and navigation
- Advanced report editing tools with real-time previews and validation
- Intelligent report summarization technology for automatic report descriptions
- Enhanced grid capabilities with advanced sorting, filtering, and grouping
- Real-time collaboration features for team-based report development
Core Reporting Capabilities
- Selecting from an expanded library of predefined reports with intelligent categorization
- Creating new reports with AI-assisted query building and validation
- Viewing report data in an enhanced grid format with advanced analytics capabilities
- Multiple export formats including CSV, Excel, PDF, and interactive dashboards
- Advanced report editing with syntax highlighting, auto-completion, and error detection
AI-Powered Features
- Intelligent Report Composer: AI assistance for creating complex queries and reports
- Automated Description Generation: AI-powered summarization of report content and purpose
- Smart Query Suggestions: Intelligent recommendations for improving report performance
- Foundation for AI Report Copilot: Advanced AI features coming soon for guided report creation
Report Configuration
When creating or editing reports, you'll need to provide:
- Name: A clear, descriptive name for the report (3-100 characters)
- Description: Detailed explanation of what the report shows (10-500 characters)
- Category: Organizational grouping for the report (required)
- SQL Query: The BigQuery SQL statement that generates the report data
- Must start with
SELECTorWITH - Must include your organization's dataset
- Supports parameterization for dynamic reports
- Must start with
Enhanced Draft Management System
The advanced draft management system provides comprehensive protection against data loss:
- Intelligent auto-save every 60 seconds with change detection and optimization
- Visual indicators for unsaved changes, saving status, and sync conflicts
- Advanced draft recovery available if you accidentally close the page or experience connection issues
- Version history tracking for draft iterations and rollback capabilities
- Collaborative editing with conflict resolution for team-based report development
- Automatic cleanup of drafts after successful save with configurable retention policies
Advanced Report Saving & Validation
- Real-time validation with immediate feedback on query syntax and structure
- Success notifications with detailed confirmation of saved changes
- Comprehensive error handling with specific guidance for resolution
- Field validation ensuring all required fields meet quality standards
- Performance optimization suggestions for complex queries
- Integration testing to verify report compatibility with existing systems
Duplicates
The Duplicates tab helps you identify and manage potential duplicate patient records. It offers:
- A list of potential duplicate entries
- Ability to compare and merge duplicate records
- Bulk merge functionality for multiple duplicates
Key Features
Custom Reports
- Create, view, and manage custom reports
- Use SQL-like queries to generate report data
- Export report data in various formats
- Auto-save protection against data loss
Advanced Grid Capabilities
The reporting grid provides powerful data analysis features:
- Column sorting (click column headers)
- Filtering (use the filter icon in column headers)
- Grouping (drag columns to the grouping area)
- Aggregation (count, sum, average, etc.)
- Column resizing and reordering
- Export to CSV or Excel
Data Visualization
- Grid views with sorting, filtering, and grouping capabilities
- Charts and graphs for visual data representation
- Date formatting for improved readability
- Automatic column type detection (text, date, number)
Duplicate Management
- Identify potential duplicate patient records
- Compare and merge duplicate entries
- Perform bulk merge operations
Tips & Best Practices
Working with Reports
- Save your work frequently, though auto-save will protect your changes
- Use the preview feature to verify your SQL queries before saving
- Check for existing drafts when reopening a report
- Clear error messages will guide you if there are any issues
- All required fields must be filled: name, description, category, and query
Writing Effective Queries
- Start with
SELECTorWITHstatements only (other SQL operations are restricted) - Always include your organization's dataset in the query
- Use the
{{dataset_id}}placeholder to reference your dataset - Keep queries focused on specific insights for better performance
- Use the auto-generate description feature to create concise report descriptions
Security Considerations
- Queries are validated for security before execution
- Parameter values are sanitized to prevent injection attacks
- Reports are organization-specific and respect access controls
- Error messages are designed to be informative without exposing sensitive details
By utilizing these reporting features, you can gain valuable insights into your organization's data, streamline your operations, and make informed decisions based on accurate and up-to-date information.